Mapbox Studio: Creating an Avalanche Atlas
Published on Feb 7, 2021 by Ben Tyler
This post is part of my free Building Interactive Maps with React course - a course for anyone wanting to learn how to build interactive maps and integrate them into their React applications. If you enjoy this guide, then chances are you will enjoy the course too!
The aim of this post is to walk you through how you can create a custom map using Mapbox Studio and then add that map to a React application.
There are a lot of cool maps out there in the outdoor industry and natural resource management fields. One of my favorite map types though are avalanche atlases. They give you an intimate glimpse into where the fiery white dragons have historically reared their heads most frequently.
We will be using Mapbox Studio to develop our own avalanche atlas for Little and Big Cottonwood Canyons. These canyons are fabled for their avalanche activity as well as the science and art of avalanche control that have grown out of it. It makes you appreciate all of the hard work of the Utah Avalanche Center, transportation departments, and ski patrol that help keep these corridors open.
Introduction to Mapbox Studio
If you have not worked with Mapbox Studio before, here is a quick primer. Studio is a browser based application that allows you create just about any type of map you can dream up. You can start with one of the predefined styles I covered in my Mapbox Styles Cheatsheet or start from scratch. Like probably most people, my first introduction to GIS was through ArcMap. A powerful program for sure, but one that left me incredibly frustrated that I could not customize basemaps. With Mapbox studio, you can customize the appearance of just about any map layer, all the way down to how tiny features like how park labels are displayed.
These guide will not be an exhaustive introduction to studio. Mapbox has already provided great documentation on the subject and I would risk rambling on and on with the end result being a worse product. It is definitely worth stepping through their guides which can be found at https://docs.mapbox.com/studio-manual/guides/.
Building the Avalanche Atlas
What is an avalanche atlas?
An avalanche atlas is a map or collection of maps that portrays avalanche hazard. Not only can they show where avalanches have been known to occur, they can provide technical information like distance to major roadways, starting zone elevation, etc. They can be an incredibly powerful tool for risk mitigation and land use planning.
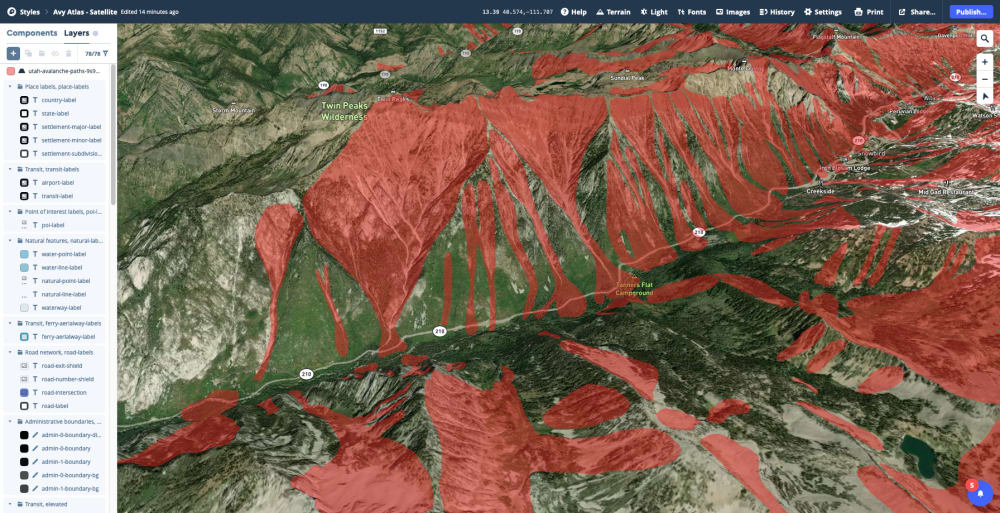
Here is a glimpse at the atlas we will be building.
Initial Setup
To get started, head on over to https://www.mapbox.com/ and login to your account (create one now if you do not already have one). After logging in, head on over to the Studio home page at https://studio.mapbox.com/ and click on the “New Style” button. This will open up a modal where you can choose a template to use for the map. Since we are building a map that is focused on the natural world and visualizing accurate representations of terrain, I think it makes sense to select the “Satellite Streets” style.
Getting Familiar with the Mapbox Studio UI
The user interface for Studio can be a bit intimidating at first (it used to be even more so before the introduction of the “Components” and “Layers” concepts). I think the Mapbox team has done a great job of masking the complexity in Studio. Once you get your feet wet, you will likely be amazed at how powerful the tool is.
Anyways, let’s get acquainted with the aspects of the UI that will be our bread and butter.
- The sidebar provides accesse to Components and Layers.
- Components groups together similar layer groups for easy styling (check out this guide for more info).
- Layers provide a more granular view of the individual layers that make up the style and exposes a lot of controls for each.
- The top application bar contains a whole slew of map style settings.
- The Search and Zoom Controls in the upper right cornerprovide an easy way to navigate around the map
Use the search bar to search for “Little Cottonwood Canyon” and then select it from the search suggestions. This will pop us over to area that we are creating an avalanche atlas for. Take a little time here to get familiar with the UI and the map.
Adding the Avalanche Paths Layer to the Map
Time to add the avalanche paths.
- Download the GeoJSON file that contains the slide paths here.
- Find the “Layers” tab in the left sidebar and click on the ”+” button. From this UI, you can add previously uploaded data to the map or upload new data. We are going to upload some new data.
- Click “Upload data”. The file picker allows us to upload a whole slew of spatial data formats such as MBTiles, KML, GPX, GeoJSON, Shapefile (zipped), or CSV file for vector tiles and GeoTIFF files for raster tiles. Upload the avalanche paths GeoJSON file and click confirm. Note: a future post will take a deeper dive into Mapbox tilesets and datasets.
- The file will take a few minutes to upload and process. After the upload has finished processing, click on the input below the “Source” label. This open up a dialog where you can select the avalanche paths we just uploaded. Find the source in the list and select it.
We are currently in the “Data” view for our layer. We will gloss over all the functionality exposed here but you can do all sorts of things like specify the geometry type, filter features, and control the zoom range at which the layer is visible.
Styling the Avalanche Paths
Now that we have the avalanche paths layer added to our map, we can style it.
- Click on the “Style” tab to the left of the “Select Data” tab. If you zoom out a bit on the map, you should see all of our avalanche paths as solid black polygons on the map. There sure are a lot of them!
Time to make these look a whole lot better!
- Select the “Color” item from the “Style” pane, you should see a color picker. We will want to change the fill color to a nice red and add some transparency to the polygons. I personally like the color
#ec2222and an opacity of 45 (use the opacity slider directly below the color picker or the input to the right of the slider).
Looking much better! It really gives you an appreciation for just how many avalanche paths intersect the roadways in these canyons and the crazy hard work that the avalanche centers and transportation departments are tasked with.
Bonus: Viewing the Avalanche Paths in 3D
This is a brand spanking new feature in Mapbox Studio, but you can now render 3D terrain (see my earlier post). For a use case like avalanche slide paths, being able to visualize them in 3D is such a step up. Here is how to do so.
- Click “Terrain” in the top navigation bar and flip the toggle that says “Enable 3D Terrain”.
- Adjust the pitch of the map camera by holding down the Control/Ctrl key and moving your mouse forward and back to your liking (reverse these steps to go back to 2D).
Soaking It All Up
All in all, a pretty simple process to create our own custom map! I encourage you to take some time to explore Studio before moving on to the next steps.
Adding the Custom Style to a React Application
I wrote an earlier post as part of this series that illustrated how to create a basic interactive map using Mapbox and React. This next step builds off of that tutorial so if you have not read it and are not overly familiar with Mapbox GL JS, definitely give it a read.
Similarly to how it is easy to swap out predefined Mapbox styles in our application, it is just as easy to add in our own style. In Mapbox Studio,
- Click “Publish” in the upper righthand corner.
- Walk through the steps in the dialog to publish the map.
- After it is published, click the “Share” item immediately to the left of the “Publish” button.
- In the subsequent dialog, look for the section titled “Developer resources” and find the form input labelled “Style URL”. Copy this url.
Now in your React application, where the snippet where you initialize your map. It should look something like this.
// create the map and configure it// check out the API reference for more options// https://docs.mapbox.com/mapbox-gl-js/api/map/const map = new mapboxgl.Map({ container: mapContainer.current, style: "<YOUR STYLE URL HERE>", // TODO REPLACE ME center: [-111.676, 40.549], zoom: 13,})All you have to do now is the following:
- paste the copied Style URL into the
styleproperty on the map config. - find a zoom and map center you like by panning the map around in Studio. Copy the zoom level and coordinates from the top application bar. Set the
zoomandcenterproperties to these accordingly.
Save your work, start up the app, and you should now be seeing your very own avalanche atlas for Big and Little Cottonwood Canyons.
Next Steps
- try customizing some of the other map layers
- try labelling the avalanche slide paths
If you found thus post useful, give me a follow on Twitter or consider picking up a copy of the Building Interactive Maps with React course.
Useful Links and Resources
- Mapbox Studio Home Page (https://studio.mapbox.com/)
- Mapbox Studio Guides (https://docs.mapbox.com/studio-manual/guides/)
- Mapbox Style Components (https://docs.mapbox.com/studio-manual/guides/components/)
- Source for the Avalanche Paths (https://opendata.gis.utah.gov/datasets/utah-avalanche-paths)
- Utah Avalanche Center (https://utahavalanchecenter.org/)
- More info on Avalanche Atlases (https://instaar.colorado.edu/research/publications/occasional-papers/avalanche-atlas-san-juan-county-colorado/)
- One of my personal favorite podcasts. All about avalanches (https://www.theavalanchehour.com/)
About Me
Howdy, I am Ben Tyler. I am a product-focused engineer who cares deeply about finding the simplest solution to a user's problem.
I love collaborating on projects, so if you need a hand, please schedule a call or get in touch at hello@lostcreekdesigns.co!
Schedule a Call!